WaterSmart Dams
WaterSmart Dams Water Quality results
Results from a recent water quality survey conducted by the WaterSmart Dams team revealed that some water sources being used for herbicide applications fell outside the ideal range for effective herbicide efficacy if untreated.
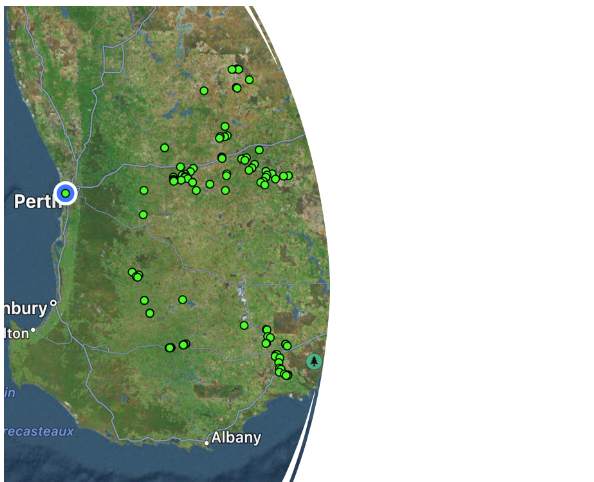
One hundred and thirteen samples from bores, dams, rain-water and scheme water throughout Western Australia’s South-west were analysed during winter 2022 and summer 2022/23 to benchmark water quality standards and see how they varied over the season. An additional 68 samples were collected from the Mid-wheatbelt region in winter 2023 with a subsequent summer sample collection in 2023/24 so the results of this region will be presented in the future (Figure 1).
The effectiveness of agricultural chemical applications can be significantly compromised by the quality of water used for mixing. Poor water quality can not only diminish the performance of agricultural chemicals on target crops and weeds but can also obstruct spray lines and nozzles or accelerate the wear and tear of spray equipment which causes uneven chemical distribution.
Figure 1 Location of water samples collected in the Mid and South-west wheatbelt region of Western Australia. Samples included rainwater, bore, scheme and dams
The Results
The results of the South-west WA wheatbelt region were presented by project technical lead UWA Associate Professor Nik Callow, Senior Research Officer Roberto Lujan Rocha and SW WA Hub student bursary recipient Jane Brownlee at the Merredin and Districts Farm Improvement Group (MADFIG) AGM. They highlighted that if the water being used for herbicide application is not being treated correctly, the resulting solution (after the chemical has been added to the water) may fall outside of the optimal range for effective spraying.
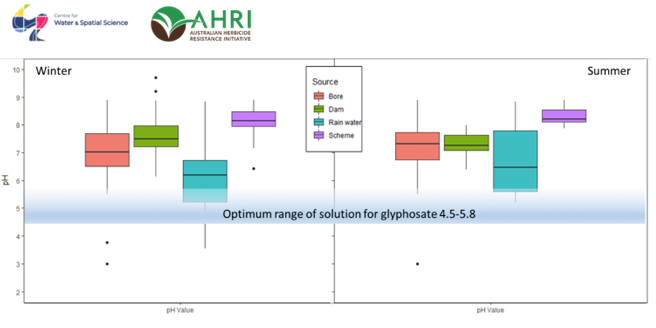
For example, Figure 2 shows two boxplots for winter and summer showing the distribution of pH values according to water source and across all the sites in the survey. The boxplots show large variability in pH between the different water sources in early winter, a time when some farmers might still be seeding and doing their knock down herbicide applications.
It is generally considered that the ideal pH range of water to be mixed for the most effective herbicide use is between 6.5 and 8.5. However, when using glyphosate, the optimum range of the solution is much lower, sitting between 4.5 and 5.8. Glyphosate is an acid, so by itself it can lower the pH of the water by up to 2 units. If your water sample falls somewhere between pH6-8 then glyphosate might be good enough to bring it down to the optimal pH range.

Figure 2 Range in pH for water samples collected from bores, dams, rainwater and scheme water. The rectangle represents 50% of the values, the dark line within the rectangle represents the median value. The whiskers show the top and bottom 25% of the values, and the individual dots are abnormal or extreme values.
pH is just one piece of the puzzle
There are other characteristics of water that can affect how much the pH of the solution might change when mixed with glyphosate. For example, total alkalinity (bicarbonate alkalinity) determines how much the water will resist a change in pH. Bicarbonate ions (HCO3-) are the major contributors to alkalinity in water and these ions act as a buffer, meaning they can neutralise both acidic (low pH) and bases (high pH) water, keeping the pH relatively stable. Water hardness is also an important measure as it indicates the abundance of cations or positively charged molecules in water. Calcium and Magnesium are the most problematic cations as they can bind to glyphosate molecules which effectively reduces the rate of herbicide applied to plants. Water hardness above 200 ppm should be treated prior to adding glyphosate. Mark Congreve from Independant Consultants Australia Network (ICAN) has an easy rule of thumb to treat hard water: Add 100g or 100L of ammonium sulphate (AMS) for each 100 ppm of total hardness which will get you “close enough”. However, if you want to be more precise use this formula:
Kg ammonium sulphate /100 L = (0.001 x Ca (ppm)) + (0.0006 x Na) + (0.0002 x K) + (0.0017 x Mg)
One of the survey outcomes was the ambiguity among farmers about how water hardness is also important for other herbicides like Clethodim, Dicamba, MCPA, 2,4_D, Clopyralid, Diflufenican, Gluphosinate, Imazapyr, Sulfometuron methyl.
Additionally, there are other important factors to consider, turbidity, which is the level of “muddiness” of the water. This can reduce the effectiveness of herbicides like glyphosate and paraquat, and also cause nozzle blockages. Salinity greater than 500 microsiemens/cm can cause chemicals to precipitate out of the solution or make the herbicides inactive.
Poor water quality can impact plant coverage, application rates and has the potential to increase herbicide resistance in the long term. Therefore, a water quality test should analyse pH, total hardness (including bicarbonates), salinity (EC), and turbidity to ensure they are in the right parameters for improved spray efficacy.
So, what about those seasonal changes?
The results suggest that water quality might change between seasons (winter-summer) regardless of the water source. The variables measured changed positively for some samples and negatively for others so there was no clear pattern. One hypothesis is that this change could be due to the type of tank in which the water is being stored, and the environmental interactions between the water and the atmosphere if the tank has left the water exposed. Further testing is required to confirm this.
Testing your water at the point of extraction for tank mixing at least every year is very important and might mitigate financial loss due to herbicide inefficacy. Importantly, the herbicide tolerance to different water qualities is different depending on the herbicide being used.
For further information on commonly used herbicides and herbicide efficacy the GRDC (Grains Research and Development Corporation) spray water quality publication is a useful tool. Read it here.

